Sunday, 22 July 2012

Informatica Installation on Windows 7- Server installation and starting Repository and Integration Services

Finally successful in installing Informatica on my PC. :)

OS - Windows 7
Informatica version 8.6.1

Installation of Informatica Server:

Below is the list of issues faced during installation and their remedies:

1. During Server Installation - Click the option "Windows SP3" to make it compatible to OS.

2. During Server Installation:  Informatica Services not starting
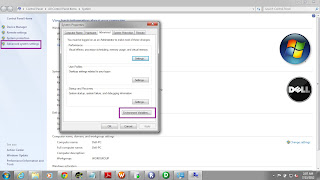
  • Install Java, JRE and Apache Tomcat in your PC.
  • Go to My Computer -> Properties -> Advanced system Settings


Set the Variables 

JAVA_HOME = C:\Program Files\<Java.exe path>
JRE_HOME=C:\Program Files\Java\<JRE> 
PATH=C:\Informatica\PowerCenter8.6.0\server\bin;


Once the following prerequisites are completed, start the Server installation.
TIP: Browse to the install.exe file and "Run as administrator"
       From the drop-down list, select OS as "Windows Service Pack 3"


Once, the Server setup is completed, go to Services.msc and check the Informatica Services.
If the status is Started, your installation was successful.

Else, close windows firewall and then restart the service.


We will configure and start Repository Services in the next Blog !!
We will also create ODBC connection between Teradata and Informatica.

Please let me know your doubts/comments .


Tuesday, 17 July 2012

Risk Assessment using Teradata - The use of Mathematical Functions

Mathematical Functions in Teradata:

The following table illustrates the year-on-year transactions of a Loan account. A loan account has the Collateral and the Amount to be paid columns.


If you notice, the area where the Blue indicator(Asset with Bank) goes below the Green Indicator(Amount to  be paid/Risk Exposure), is the Risk-Zone.
If the Customer defaults in this zone, the Bank will have lower assets to recover the loan. This is a classical example of Risk-Management.
All such risks are covered by the BASEL-2 norms.

How Teradata Helps?

Functions in Teradata like SUM and CSUM will help us to effectively calculate the value in the FACTS.
We can decide on these metrics, and then populate the RATE column in the dimension from Real-time Systems.
During FACT populations, the following steps can be performed:

1.  the Current Value of Collateral is calculated
2. The Amount repaid is calculated
3. They are projected over a period.

A Flag can be set in the Report file/Aggregates marking the Customer account as Risky

Example: If the State-run Banks had implemented this strategy, then the defaulting of Kingfisher Airlines could be predicted. A total of INR 50 billion was borrowed by the airline, but the collateral tracking could have saved the day for the Lenders.


Your queries/suggestions are always welcome !!

Wednesday, 11 July 2012

Difference between Rank() and Row_Number() functions


RANK ():- RANK returns ranking (order) of rows based on the number or expression given in the ORDER BY clause.

ROW_NUMBER ():- It returns the sequential number of the row within a group, starting with 1 based on the ORDER BY clause.

We will see the difference between these 2 functions based on an example:


EMPID

ENAME

SALARY

DEPT_ID

RNK

ROWNUM

1

MATT

1000

10

1

1

4

SHANE

1000

12

1

2

2

SCOTT

2000

10

3

3

7

MARY

2000

10

3

4

3

JEAN

2000

10

3

5

5

DEAN

4000

10

6

6

6

LISA

4000

10

6

7


Now, in a practical scenario, we are required to find the all the employees having Nth highest salary.
In such cases, we can use the below query:

SELECT
  E1
.EMPID
  ,
E1.ENAME
  ,
E1.SALARY
  ,
E1.DEPT_ID
  ,
RANK() OVER(ORDER BY E1.SALARY ASC) AS RNK
  ,
ROW_NUMBER() OVER(ORDER BY E1.SALARY ASC) AS ROWNUM
FROM
TL_62917_DLY1_QRMDB
.EMP1 AS E1
WHERE
(
E1.SALARY =
SELECT
SAL2.SALARY FROM
(
SELECT
SAL1.SALARY,SAL1.RNK FROM
(
SELECT
SALARY,RANK() OVER(ORDER BY SALARY DESC) RNK FROM TL_62917_DLY1_QRMDB.EMP1
GROUP
BY 1
)
SAL1
WHERE
SAL1.RNK= ?RNK
)
SAL2
)

Output for a value of ?RNK =2 will be:


EMPID

ENAME

SALARY

DEPT_ID

RNK

ROWNUM

3

JEAN

2000

10

1

1

2

SCOTT

2000

10

1

2

7

MARY

2000

10

1

3


This query will return Nth salary even if duplicate values are present in the Salary column.
If you look at the above table, 2000 is the 2nd highest salary.


Extract last N digits from a Column


How to extract the last N digits from a column?

 
The substring function is used to extract a part of a string. It has 3 inputs:
Substring(<Column>, <Start>, <End>)
If we don’t specify the <End>, it extracts till the end of column.
In working conditions, generally the columns may contain Blank characters:
Below is an example to deal with such scenarios:


SELECT
TRIM(ARRG.SOURCE_ARRANGEMENT_NUMBER) AS SAN
,
CHAR_LENGTH(TRIM(ARRG.SOURCE_ARRANGEMENT_NUMBER))-6 AS LEN_WITHOUT_BLANK
,
CHAR_LENGTH(ARRG.SOURCE_ARRANGEMENT_NUMBER)-5 AS LEN_BLANK
,
SUBSTRING(TRIM(ARRG.SOURCE_ARRANGEMENT_NUMBER) FROM CHAR_LENGTH(TRIM(ARRG.SOURCE_ARRANGEMENT_NUMBER))-5 FOR CHAR_LENGTH(TRIM(ARRG.SOURCE_ARRANGEMENT_NUMBER))) as Profit_Centre
FROM TA_62917_QRMDB.ARRANGEMENT ARRG;


SAN

LEN_WITHOUT_BLANK

LEN_BLANK

Profit_Centre

1088713

2

27

88713

6002804180

5

27

04180

1211176

2

27

11176

Tuesday, 10 July 2012

Select and Delete a Row in single DML- Better job control

Can we Select a row and delete the row in a single SQL?


-----------------------------------------------

---- Select and delete in the same statement---

SELECT AND CONSUME TOP 1 * FROM TA_62917_QRMDB.VERSION_QRM;

How it helps?

1. It becomes an efficient way of maintaining the latest records in the Journal/Control tables of a Batch.

2. Control tables that contain the aggregation job-names, will be processed one by one. So, it helps in dependency control.

RunAggregate.ksh <Aggregate_Name>

where <Aggregate_Name> is taken from

1

TAG_MICR_PAIE

2

TAG_SER_BILLING

3

TAG_MON_BILLING


3. Environments synchronisation can be done using the above query.

Example: If a file is transferred from Mainframe server to UNIX server.
Command : Sendfile.ksh <Filename>
Where <filename> is the output of
SELECT AND CONSUME TOP 1 * FROM TA_62917_QRMDB.VERSION_QRM;

Thus once the file is sent, chances of sending the file again is NIL.

--------------------------------------------------------

Why should we Collect Statistics on Partition

Why should we Collect Statistics on Partition?

 These are a few details on the importance of collecting stats on PARTITION keyword. Please make sure to add this for all your target tables.
  1. This is more quick method for getting information like select count(*) statements.
  2. This does not take time to collect stats and goes into cylinder headers and collects data.
For accurate information, collect statistics every time any data modification happens to that table.

COLLECT STATISTICS TA_EDW_SCDB.TXN_MASTER_RETAIL COLUMN PARTITION;
*** Update completed. One row changed.
*** Total elapsed time was 44 seconds.

HELP STATS TA_EDW_SCDB.TXN_MASTER_RETAIL COLUMN PARTITION;


Date

Time

Number of Rows

Number of Nulls

Number of All Nulls

Number of AMPs

Average AMP RPV

OneAMPSampleEst

AllAMPSampleEst

11/7/2019

5:10:19

270,155,352

0

0

25

0

270320650

270127450

11/7/2019

5:10:19

270,155,352

0

0

25

0

270320650

270127450

Features of Fastload with examples

Fast-load has the following features: 
Important observations:
  1. We can load both SET and MULTISET tables using Fastload

  2. Fastload supports Primary Index (both PI and UPI). Teradata Fastload does not support join indexes, foreign key references in target tables and tables with secondary index defined. It is necessary to drop any of the constraints listed before loading and recreate them afterwards.
  3. If duplicate records are present in the source file, and we are loading a MULTISET table, the duplicates will be silently dropped, since fastload does not support duplicates.

  4. For data :
    mathew|19111987
    karan|24121987
    gaurav|24101986
    gaurav|24101986
    Data loaded in table is:

    NAME

    DOB

    Mathew

    19/11/1987

    Gaurav

    24/10/1986

    Karan

    24/12/1987
    **** 07:28:21 END LOADING COMPLETE
    Total Records Read = 4
    Total Error Table 1 = 0 ---- Table has been dropped
    Total Error Table 2 = 0 ---- Table has been dropped
    Total Inserts Applied = 3
    Total Duplicate Rows = 1
    We get the above report at the end of loading.
  5. If we define a delimiter, then FLD expects VARCHAR, VARBYTE only in the .DEFINE layout definition.

  6. **** 07:28:17 Now set to read 'Variable-Length Text' records
    **** 07:28:17 Delimiter character(s) is set to '|'
  7. If dates are present in the input file, then load using

  8. 0015 INSERT INTO tl_62917_dly1_qrmdb.fld1
    VALUES
    (
    :NAME,
    :DOB(date, format 'ddmmyyyy')
    );

    Please note that the date format is for  the DATE format in the INPUT file.


  9. If FLD fails due to data errors, then to find the records that failed, perform the following steps:
Total Records Read = 4
Total Error Table 1 = 3
Total Error Table 2 = 0 ---- Table has been dropped
Total Inserts Applied = 0
Total Duplicate Rows = 1
Write a bteq :
.logon server1/user1,mar@2012;
.export data file=fastload_error.txt
select trim(dataparcel) from TL_62917_DLY1_QRMDB.FLD1_ET;
.logoff
The DataParcel column in _ET table is LOV, so it can only be read if the export file is DATA

You can revert back with your queries, if any.

How to write a sample Fastload script?


How to write a sample Fastload script?

A fastload script will load data into a single table from one/more files.
Multifile loading will be covered in a future post.

A single file Fastload example is given below:


---------------------------

SESSIONS 5;

TENACITY 5;

SLEEP 5;
ERRLIMIT 50;
.logon server1/user1,passwd123;
DROP TABLE TL_62917_DLY1_QRMDB.FLD1;
CREATE MULTISET TABLE TL_62917_DLY1_QRMDB.FLD1
(
NAME VARCHAR(20)
,DOB DATE format 'yyyy-mm-dd'
)
PRIMARY INDEX(NAME)
;
DROP TABLE tl_62917_dly1_qrmdb.fld1_WT;
DROP TABLE tl_62917_dly1_qrmdb.fld1_ET;
DROP TABLE tl_62917_dly1_qrmdb.fld1_UV;
 
.SET RECORD VARTEXT "|";
DEFINE
NAME (VARCHAR(20)),
DOB (varchar(20))
 
 
FILE=/wload/wzed/app/subwload/ALL_DWH/sql/NON_INCOME/fld1.csv;
SHOW;
BEGIN LOADING tl_62917_dly1_qrmdb.fld1 ERRORFILES tl_62917_dly1_qrmdb.fld1_ET , tl_62917_dly1_qrmdb.fld1_UV

CHECKPOINT 1000;

INSERT INTO tl_62917_dly1_qrmdb.fld1
VALUES
(
:NAME,
:DOB(date, format 'ddmmyyyy')
);
 
END LOADING;
.LOGOFF;
.QUIT;

FASTLOAD:
---------------------------


How to improve the Fastload performance:

1. Check the total sessions assigned for the FASTLOAD. Higher the sessions, lesser the time.

2. If you are loading a very large file, increase the .CHECKPOINT.
    A checkpoint regularly makes an entry about the rows successfully loaded. So, its an overhead.

    Rule of thumb: Set a checkpoint at 10% of your total row-count in the file.


Share with us your problems, and we will help you solve them.
Donate if you are helped.
 For any training inquires please call us or fill the inquiry form on the right.

How to replace a string in a column using Teradata functions?


How to replace a string in a column using Teradata functions?

We can use the Oreplace function in Teradata.

Oreplace function usage:

Syntax :- OREPLACE(Column_name, ’Old_String’, ‘New_String’)
Functionality :- This function is used to replace any particular character or string with another character or string without the concern of how many times the string is coming in the particular value.
Example :-
Suppose we have values in table exmpl like this
Column1 Column2
abc$xyz 10
xz$saas 20
$ads$asd 30
man$all 40
as$fsadf$ 50
Now suppose we want to fetch the data and in the report I want to change ‘$’ character with ‘@’. So we can write as
Select
OREPLACE(Column1,’$’,’@’) , Column2
From exmpl;
Then the output will be like this
Column1 Column2
abc@xyz 10
xz@saas 20
@ads@asd 30
man@all 40
as@fsadf@ 50

How to do weighted average in Teradata?

As per the definiton of weighted average, its is the sum of datapoints*weights / sum of weights. Hence each data point contributes to the average according to the weight associated to it.

For example: Table Fact_Balance_01 has columns
Book_Balance
,Term

To calculate a weighted average Balance_Term , we have

Select
    Term
    ,Sum(Book_Balance * Term)/Sum(NULLIFZERO(Book_Value))
From
Fact_Balance_01
Group by 1

How it helps?

Over a period, it gives us a graph. Also called the SMA graph.
It can be effectively used to see where your business is headed.